
How to Measure Event Marketing Success
Marketing is an important aspect of any successful business. It helps companies increase brand awareness and reach new potential customers. However,...
10 min read

Every mile your fleet travels is a marketing opportunity, but the real question is whether those graphics on your vehicles are actually boosting sales. Tracking ROI on fleet graphics comes down to connecting impressions and brand visibility with measurable actions, such as calls, web visits, and new customer conversions. When businesses take the time to set benchmarks and utilize simple tracking tools, they can demonstrate that vehicle wraps are more than just moving billboards; they’re a cost-effective driver of revenue.
For instance, studies show fleet graphics can cost as little as $0.15 per thousand impressions versus up to $21 for online ads, underlining their high return on investment.
Read this blog to learn why tracking the ROI of your fleet graphics is essential and how it can turn every mile your vehicles travel into measurable business growth.
Fleet graphics have the power to make a brand recognizable in every neighborhood, on every highway, and at every job site they pass. What sets them apart from many other forms of advertising is their ability to deliver repeated impressions without incurring recurring ad spend. Yet for many marketing and operations teams, the challenge comes down to proving whether those impressions are actually producing revenue.
As shown in “Outdoor advertising effectiveness evaluation from customers’ view,” impressions alone don't guarantee conversion; the design, exposure, and follow-through must drive buyer behavior.
When viewed through the lens of return on investment, fleet graphics should be treated like any other marketing channel. Billboards, pay-per-click campaigns, and social ads all demand proof of performance, and vehicle graphics are no different. By applying ROI measurement, companies can compare the value of fleet advertising alongside other investments. An ROI modeling study for OOH media demonstrates how outdoor channels can be benchmarked and optimized across sales and brand metrics.
For marketing leaders and fleet managers, precise ROI tracking is not only about validating spend but also about planning for future campaigns. If a wrapped vehicle proves to consistently drives new calls or online inquiries, leadership gains the confidence to expand the fleet or refresh graphics more frequently. Without this visibility, graphics risk being viewed as a sunk cost instead of a revenue-generating asset.
ROI tracking is especially important for fleet graphics because, unlike digital campaigns, they don't come with built-in analytics dashboards. Businesses need to add tracking methods to measure performance intentionally. Without this step, it’s easy for vehicle wraps to be overlooked as a branding expense when, in reality, they can be one of the most efficient sales drivers.
Launching a fleet graphics program without a benchmark is like running a race without a finish line. To prove ROI, you need a clear starting point that shows where your business stood before the first vehicle with new graphics ever hit the road. Establishing this foundation ensures that every lead, call, or sale can be quickly tracked back to the investment.
The literature echoes the necessity of defining baseline metrics and establishing accountability before execution. In "Marketing Performance Assessment and Accountability: Process and Challenges," the authors stress that performance measurement systems must be designed upfront, with clear metrics and control data, to assess the incremental impact of marketing investments meaningfully.
Before wrapping your fleet, record key data such as current sales volume, incoming calls, website visits, and inquiries from local markets. This provides a control point, making it easier to identify the lift in results once the vehicles are in motion.
The importance of such baseline periods is integral to causal inference methodologies. For example, the Bayesian structural time-series framework uses pre-intervention data to model the counterfactual (i.e., what would have happened without the change), allowing the observed post-intervention effect to be more reliably attributed to the intervention itself.
Not all vehicles perform equally, and neither do all service areas. By segmenting performance data by vehicle type, geography, or customer demographics, companies can more effectively pinpoint which graphics and routes yield the most substantial returns. This also enables the design of controlled comparisons or A/B testing setups. The literature on marketing accountability emphasizes that segmentation and attributing outcomes across units or channels are essential for rigorous measurement and accountability.
Fleet graphics should be viewed as a multi-year investment rather than a short-term campaign. The durability of materials, the quality of installation, and the anticipated replacement cycle all influence ROI. Accounting for these factors up front allows companies to evaluate ROI across the entire useful life of the graphics, not just the first few months.
Setting a baseline is not just a marketing task. Operations teams should be involved to ensure vehicle use, mileage, and service areas are factored into the ROI equation. By aligning both sides, businesses create a more realistic picture of how fleet graphics contribute to sales.
Most companies benefit from collecting at least three to six months of baseline data. This timeframe smooths out seasonal fluctuations and provides a stronger comparison once graphics are deployed. Shorter baselines may still offer insights, but more extended tracking periods lead to more accurate ROI measurements.
A well-designed fleet graphic does more than capture attention. It also sets the stage for measurable engagement. By embedding tracking tools directly into the design, companies can collect data that ties every impression to customer actions.
![]()
The study "Effectiveness of pull-based print advertising with QR codes" demonstrates how embedding QR codes in physical media can drive consumer responses and measurable digital actions, reinforcing that when thoughtful design meets smart tracking, the result is a visual piece that not only looks good but also supports quantifiable outcomes.
One of the simplest ways to measure impact is by using phone numbers that are unique to fleet graphics. These numbers can be routed to your main line but flagged in call tracking software, allowing you to see exactly how many inquiries originated from your vehicles.
This type of unique tracking attribution aligns with the principles described in credible research, which emphasizes that isolating lead generation sources and attributing them correctly is crucial for accurate ROI measurement.
Custom landing pages or short, memorable URLs printed on graphics help connect web traffic directly to your fleet. By tracking visits through analytics platforms, businesses can tie those digital interactions back to vehicle exposure with precision.
This approach aligns with the findings in "The Effectiveness of Product Codes in Marketing," which emphasize that physical marketing media (including codes or embedded URLs) should be linked with measurable digital touchpoints to support attribution and performance evaluation.
QR codes have become a standard tool for bridging the gap between physical branding and digital action. When placed strategically on vehicle graphics, they offer a quick and measurable way for prospects to connect with your business. The scans can be tied directly to promotions, forms, or lead magnets, making ROI calculations easier.
A fleet graphic should never be limited to a logo and contact information. Clear calls to action, such as “Schedule a Service Today" or "Visit Us Online," give prospects a reason to engage. Placement and font size are crucial here, ensuring the message remains legible even in busy traffic or from a distance.
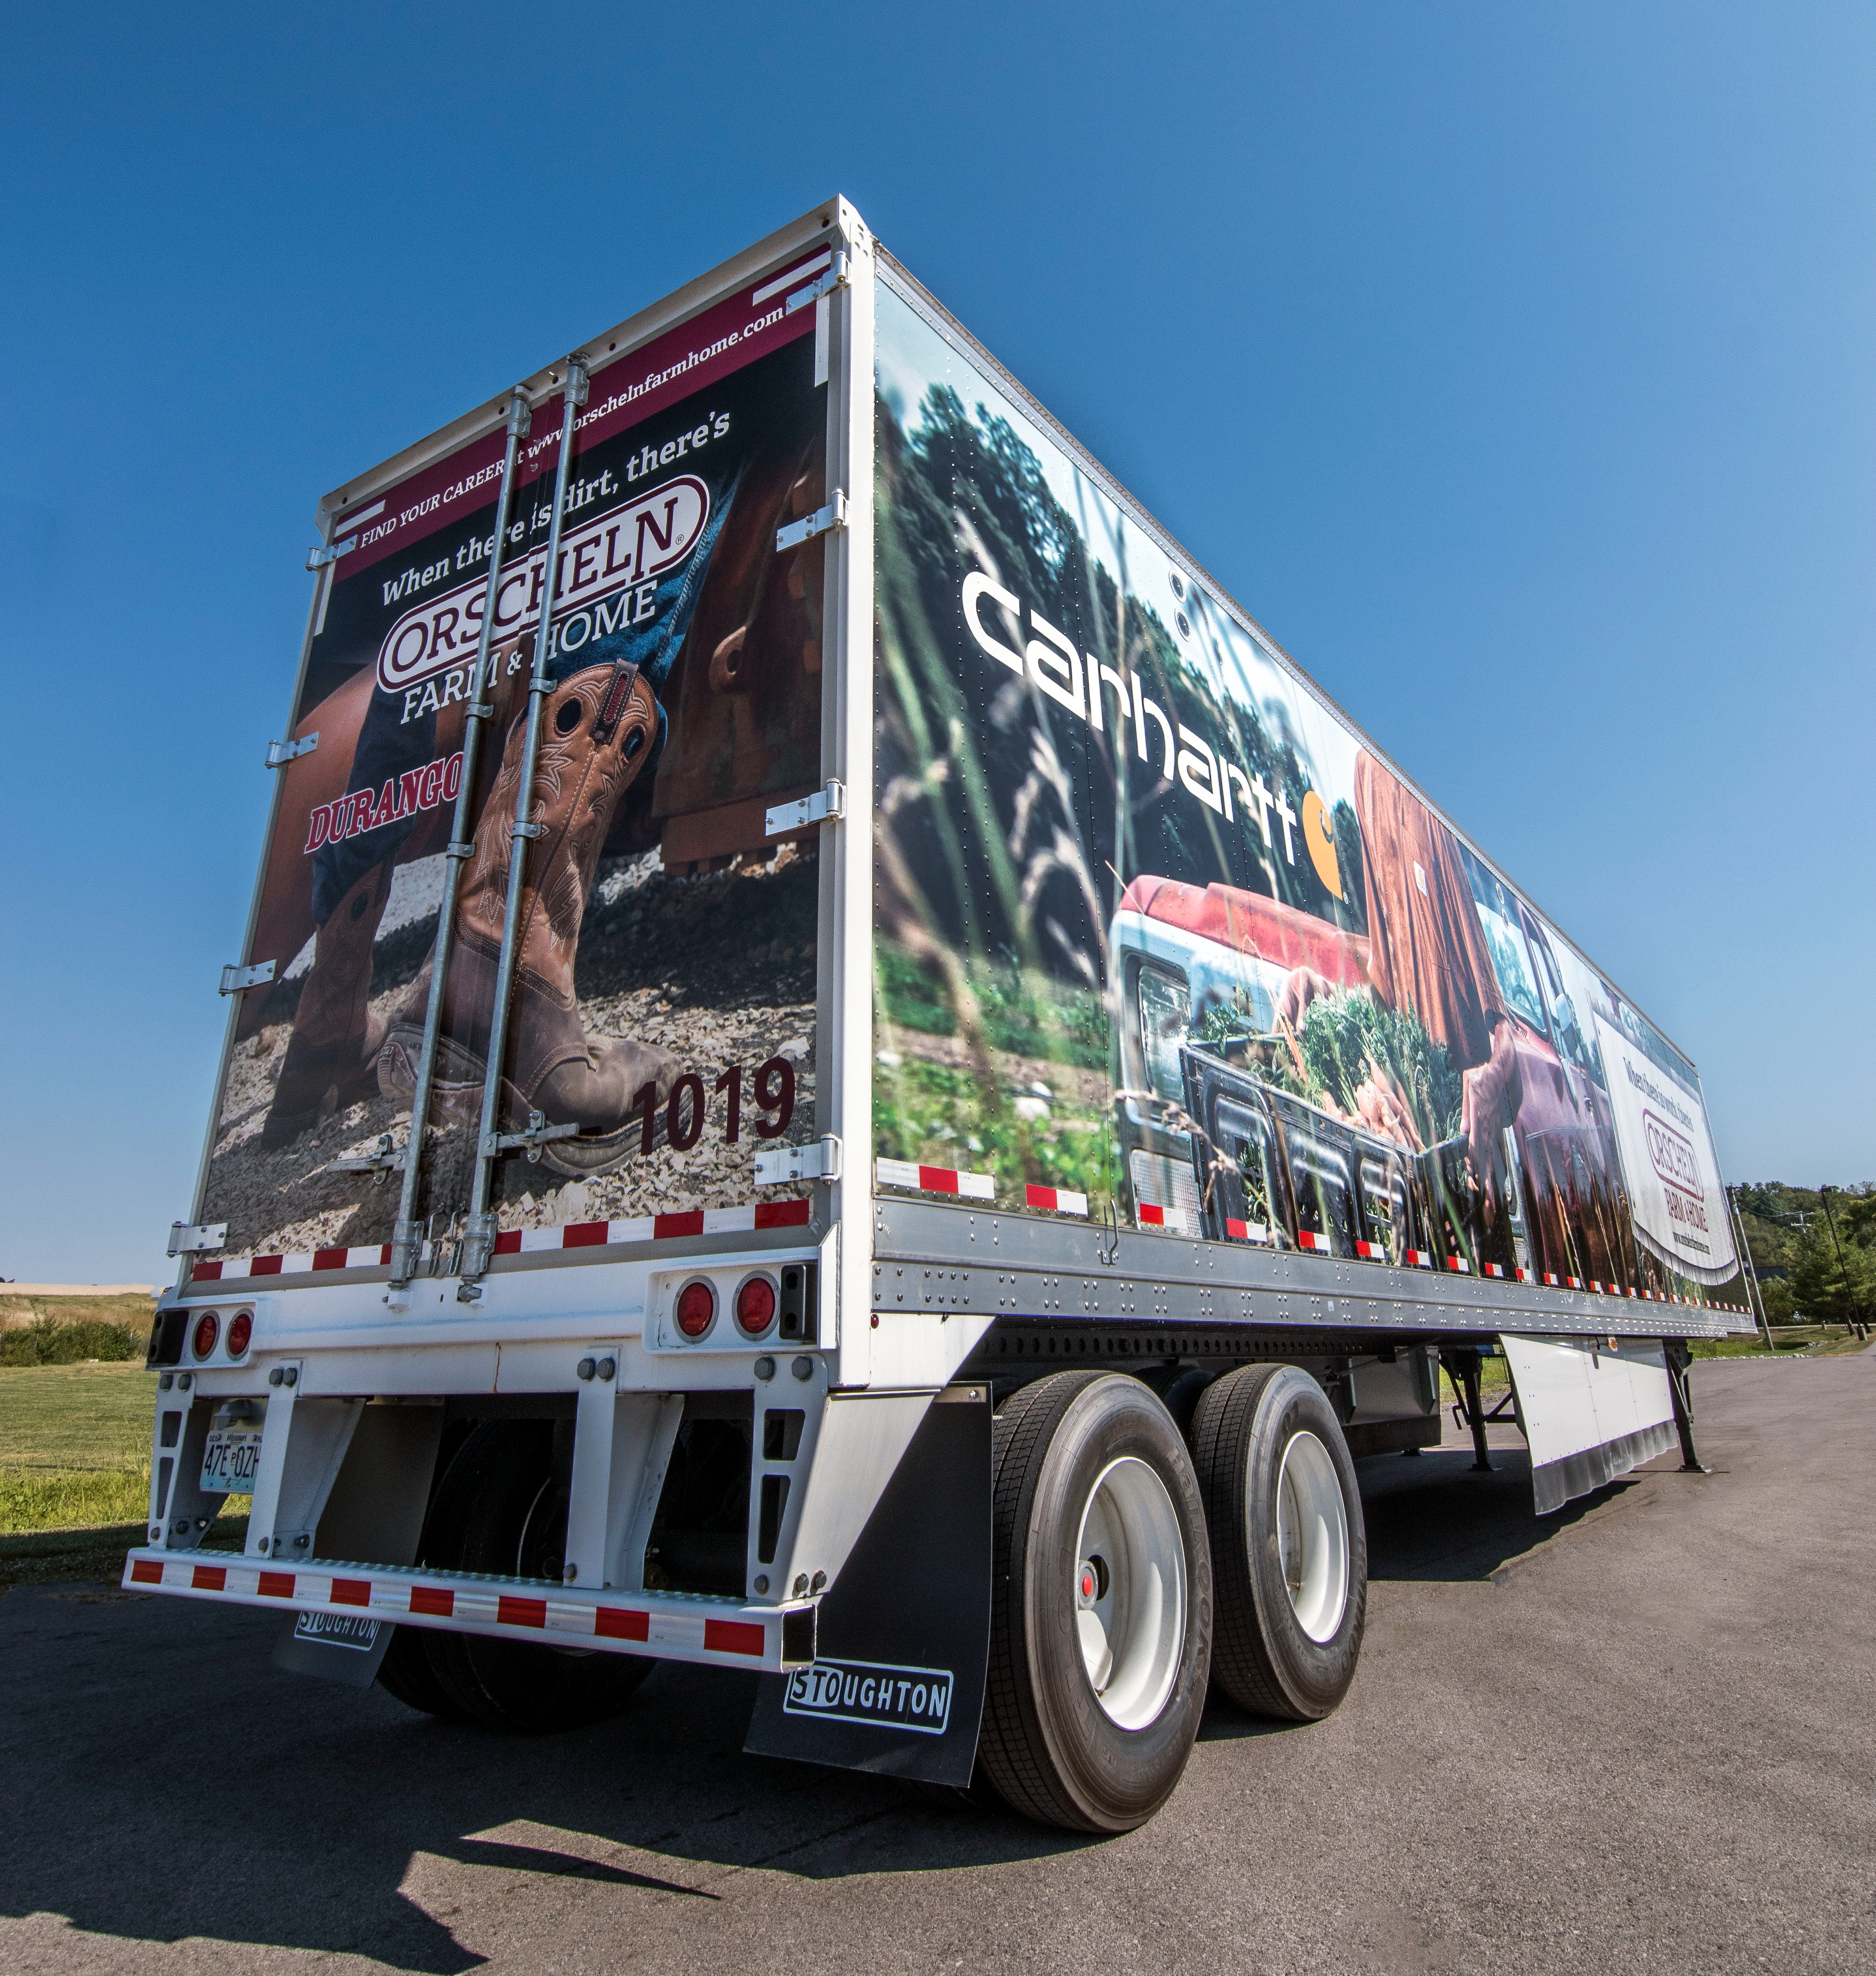
The most effective placement is typically on the rear of the vehicle, where drivers behind have time to notice and scan while the vehicle is stopped. Side panels can also work in parking lots or job sites, but rear placement generally yields the highest scan rates.
Once your graphics are on the road, the real work begins. Visibility alone doesn’t prove value until it’s connected to measurable data. By capturing and analyzing activity from calls, web visits, and customer interactions, companies can transform fleet exposure into numbers that reflect true business growth.
Dedicated phone numbers assigned to vehicle graphics make it easy to track incoming calls. Advanced call-tracking systems can measure volume, record conversations, and even score call quality to determine whether those inquiries resulted in sales.
With unique URLs and landing pages, every website visit that originates from fleet graphics can be logged. Analytics platforms then show how many of those visits led to form fills, quote requests, or direct purchases. This gives a clearer picture of the online sales funnel tied to your wraps.
Customer relationship management systems provide an additional layer of insight. By tagging leads that stem from fleet graphics, businesses can track those opportunities from initial contact to closed deal, creating a comprehensive ROI timeline.
Mapping vehicle routes against sales activity is another way to quantify impact. By comparing regions with high wrap exposure to those without, businesses can validate whether fleet activity correlates with an increase in new customers.
Sometimes the simplest approach is also the most telling. Asking new customers how they discovered your business often reveals the influence of fleet graphics. When survey responses align with call and web data, the connection to ROI becomes even stronger.
Monthly reviews are usually best for identifying patterns without getting lost in daily fluctuations. Quarterly reports are valuable for spotting long-term trends, while annual summaries help determine whether to expand or refresh graphics across the fleet.
Gathering data from calls, web visits, and CRM entries is only the beginning. To prove the true value of your fleet graphics, you need calculations that show how each vehicle directly contributes to sales. The following approaches make ROI tangible and actionable:
To illustrate how measurable returns can be calculated, the following table breaks down a sample ROI scenario using realistic cost, lead, and revenue data from a typical fleet graphics campaign.
|
Metric |
Example Value |
Notes |
|
Total Wrap Cost per Vehicle |
$3,500 |
Includes design, printing, and installation |
|
Lifetime of Graphics |
5 years |
Based on high-quality materials and certified installation |
|
Average Monthly Leads Generated |
35 |
From tracked calls, URLs, and QR scans |
|
Conversion Rate |
20% |
Leads converted into paying customers |
|
Average Sale Value |
$500 |
Standard service or product purchase |
|
Monthly Revenue Attributed |
$3,500 |
35 leads × 20% × $500 |
|
Payback Period |
1 month |
Investment paid back in the first month |
|
ROI Over 5 Years |
5900% |
Revenue vs. initial cost calculation |
A strong ROI often means recovering the cost of the graphics within the first few months and generating revenue many times greater than the investment over their lifespan. For many businesses, an ROI of several hundred percent is common, while companies with high vehicle mileage often see returns of well over $10,000.
Tracking ROI is only half the battle. To maximize returns, businesses need to fine-tune how their fleet operates on a day-to-day basis. Minor adjustments in exposure and maintenance often lead to measurable improvements in performance. Key strategies include:
Most companies benefit from reviewing their graphics every 18 to 24 months. While high-quality wraps may last longer, periodic updates keep messaging fresh, allow for seasonal promotions, and ensure the design remains aligned with current branding and customer expectations.
Even the strongest fleet graphics program can underperform if tracking methods are overlooked. Many businesses miss opportunities to demonstrate value due to simple errors that obscure the true impact of their investment. Recognizing these pitfalls early helps create a clear path to measurable success.
The most frequent mistake is failing to assign unique tracking tools, such as dedicated phone numbers or URLs, to each campaign. Without these, it becomes nearly impossible to separate fleet graphics' influence from other marketing efforts, leading to incomplete or misleading ROI data.
Fleet graphics are more than branding on wheels. With the right strategy and tracking, they become a proven sales engine that delivers measurable returns. Businesses can turn every mile into revenue by establishing clear baselines, adding trackable elements, and regularly reviewing results.
At Craftsmen Industries, we specialize in designing, fabricating, and installing fleet graphics that not only stand out but also perform. If you're ready to convert your fleet into a revenue-generating asset, contact Craftsmen Industries today, and let's build a graphics program that pays for itself and drives growth.
High-quality wraps installed by certified professionals typically last between five and seven years, depending on driving conditions, climate, and regular maintenance. Consistent maintenance protects both appearance and ROI.
Yes. By assigning tracking numbers or URLs to different territories, businesses can compare results region by region. This not only measures ROI but also highlights where graphics are driving the strongest returns.
The best approach is to set a clear baseline of leads and sales before wrapping begins. Pairing that with unique phone numbers, QR codes, or landing pages ensures that every inquiry tied to the fleet can be traced back to its origin.
Yes. Graphics with bold colors, simple layouts, and clear calls to action are more likely to generate measurable responses. Designs cluttered with excessive text or low-contrast elements can compromise both visibility and trackability.
Larger vehicles such as box trucks or trailers often generate higher visibility and impressions compared to smaller service vans. However, compact cars traveling through dense, high-traffic areas can also deliver excellent ROI. The key is matching vehicle type with driving patterns and audience exposure.
Marketing is an important aspect of any successful business. It helps companies increase brand awareness and reach new potential customers. However,...

Every mile your trucks travel becomes an opportunity to tell your brand’s story. Fleet wraps turn ordinary vehicles into mobile billboards that build...
Clever, eye-popping design is imperative when adding graphics to your fleet vehicles. As drivers catch a glimpse of your cars or trucks on the road,...