
QR codes and augmented reality on fleet wraps are interactive technologies embedded into vehicle graphics that convert passive brand exposure into measurable digital engagement. QR codes encode scannable URLs directly onto vinyl surfaces, while AR overlays 3D content onto the vehicle in real time through a smartphone camera.
This guide covers how these technologies function on fleet vehicles, why brands benefit from adding interactive layers, the QR code and AR experience types that drive results, design and technical requirements for reliable scanning, engagement measurement and attribution, common implementation mistakes, and how purpose-built experiential vehicles amplify interactive campaigns.
QR codes and AR differ fundamentally in their interaction models. QR codes redirect users to external digital destinations like landing pages or videos, while AR renders immersive 3D visuals directly over the physical wrap. Dynamic QR codes allow destination updates without reprinting vinyl, and AR trigger images require high-contrast, asymmetric patterns for reliable tracking.
Brands gain measurable value from interactive wraps through scan volume tracking, geolocation data, device-level analytics, and conversion attribution tied to individual vehicles. Each scan generates first-party engagement data that static wraps cannot provide.
Effective QR code experiences range from promotional landing pages and product demo videos to real-time inventory locators, while AR formats include 3D product visualizations, animated brand storytelling, and gamified contests that extend dwell time well beyond a typical billboard’s exposure window.
Design execution determines performance. Code sizing follows a 10:1 scan distance ratio, matte laminate improves scan reliability over glossy finishes, and flat panel placement prevents the surface distortion that breaks both QR matrices and AR tracking. Purpose-built experiential vehicles from Craftsmen Industries integrate these interactive elements at the fabrication stage, producing superior scan performance and deeper consumer engagement.
What Are QR Codes and Augmented Reality on Fleet Wraps?
QR codes and augmented reality on fleet wraps are interactive technologies embedded into vehicle graphics that convert passive brand exposure into measurable digital engagement. The sections below explain how each technology functions and how they differ.
How Do QR Codes Work on Fleet Vehicle Wraps?
QR codes work on fleet vehicle wraps by encoding a URL or digital destination into a scannable two-dimensional matrix printed directly on the vinyl surface. When a pedestrian or nearby driver scans the code with a smartphone camera, it instantly opens a landing page, video, or lead form.
Dynamic QR codes on vehicle wraps allow businesses to change the destination landing page without reprinting the vinyl, facilitating UTM parameters that monitor real-time geolocation and device data. This flexibility supports multiple use cases:
- Generating leads through sales videos or product demos
- Providing instant access to vehicle maintenance logs and inspection history
- Enabling driver assignment by positioning the code 2 to 6 inches from a dashcam for approximately 10 seconds
According to Wrapmate, vehicle wraps deliver 38 times more impressions per dollar than traditional advertising channels such as billboards, print, or radio. Adding a scannable QR code to that already cost-efficient surface turns every impression into a trackable interaction opportunity.
How Does Augmented Reality Work on Fleet Vehicle Wraps?
Augmented reality works on fleet vehicle wraps by using a smartphone camera to recognize a trigger image printed on the wrap, then overlaying 3D models, animations, or interactive content onto the real-world view. The vehicle surface itself becomes the activation point.
AR tracking algorithms generally require high-contrast detail and unique patterns in the target images to function effectively. Zappar, for example, processes tracker images in black and white rather than color, which means wrap designers must prioritize tonal contrast over color vibrancy in the trigger zone. Web-based AR platforms have made this technology more accessible by eliminating the need for dedicated app downloads, letting consumers simply point and interact through a mobile browser.
What Is the Difference Between QR Codes and AR on Wraps?
The difference between QR codes and AR on wraps is the interaction model. QR codes redirect users to an external digital destination, while AR overlays digital content directly onto the physical vehicle surface in real time.
- Trigger mechanism: QR codes require a direct scan of a printed matrix; AR uses image recognition on broader design elements.
- User experience: QR codes open a webpage or app link; AR renders 3D visuals, animations, or interactive layers on screen.
- Design complexity: QR codes need a clearly printed, adequately sized code; AR demands high-contrast trigger imagery with unique visual patterns.
- Content flexibility: Dynamic QR codes allow destination changes without reprinting; AR experiences require platform-side content updates.
For most fleet campaigns, QR codes serve as the practical entry point because of lower production complexity, while AR delivers deeper immersive engagement when the budget and creative goals justify it. Understanding these differences helps brands choose the right interactive layer for their fleet wraps.
Why Should Brands Add Interactive Technology to Fleet Wraps?
Brands should add interactive technology to fleet wraps because it transforms passive vehicle graphics into measurable, engagement-driven marketing assets. The following subsections cover how interactive wraps increase dwell time, generate trackable campaign data, and extend brand reach beyond the physical vehicle.
How Do Interactive Wraps Increase Consumer Dwell Time?
Interactive wraps increase consumer dwell time by giving viewers a reason to stop, scan, and engage rather than simply glance at a passing vehicle. A standard fleet graphic captures attention for only a few seconds. QR codes and AR experiences convert that brief window into an active interaction, holding consumer focus through video content, 3D product models, or promotional offers.
This extended engagement matters because longer dwell time strengthens brand recall. According to Sign Art Graphix, vehicle wrap advertising can increase brand awareness by as much as 15 times compared to other traditional media. When interactive elements are layered onto wraps that already command high visibility, each impression carries significantly more weight. For brands running large fleets, even modest gains in per-viewer engagement compound into substantial awareness lifts across thousands of daily impressions.
How Do QR Codes and AR Generate Measurable Campaign Data?
QR codes and AR generate measurable campaign data by creating trackable digital touchpoints on every wrapped vehicle. Each scan or AR activation captures specific metrics:
- Scan volume and frequency per vehicle, route, or market
- Geolocation data showing where interactions occur
- Device and browser information revealing audience demographics
- Landing page behavior including time on page, clicks, and conversions
- UTM parameter tracking linking scans to specific campaigns or promotions
This data turns fleet wraps from an awareness channel into a performance marketing tool. Marketers can compare scan rates across cities, time of day, or vehicle types, then optimize routes and creative accordingly. Unlike traditional out-of-home media, where impression counts rely on traffic estimates, interactive wraps deliver first-party engagement data tied to real consumer actions.
How Does Interactive Technology Extend Reach Beyond the Vehicle?
Interactive technology extends reach beyond the vehicle by connecting a physical fleet asset to digital channels that audiences engage with long after the initial encounter. A single QR scan can route a consumer to a landing page, social profile, app download, or email signup, creating an ongoing relationship that outlives the moment of visual contact.
This digital extension is especially valuable given the market’s growth trajectory. According to Gitnux, the global vehicle wrapping market was valued at $4.5 billion in 2022 and is projected to reach $8.2 billion by 2030, representing a compound annual growth rate of 7.8%. As more brands invest in fleet wraps, interactive layers become the competitive differentiator that converts impressions into measurable digital actions. With the right interactive strategy, knowing what types of QR code experiences drive results becomes the next critical decision.
What Types of QR Code Experiences Work Best on Fleet Wraps?
The types of QR code experiences that work best on fleet wraps are promotional landing pages, product demonstration videos, event registration forms, social media links, and real-time service locators. Each experience type converts passive impressions into trackable consumer actions.
Promotional Landing Pages and Discount Offers
Promotional landing pages and discount offers are among the highest-converting QR code experiences for fleet wraps. A dynamic QR code directs scanners to a mobile-optimized page featuring time-sensitive coupons, seasonal deals, or exclusive pricing. Because dynamic QR codes allow businesses to change the destination landing page without reprinting the vinyl, fleet managers can rotate promotions by region or campaign cycle while keeping the same physical wrap. According to 201WRAP, dynamic QR codes also facilitate the use of UTM parameters to monitor real-time geolocation and device data, making each scan measurable. For fleet campaigns covering multiple metro areas, this flexibility turns every vehicle into a localized promotion engine.
Product Demonstration Videos
Product demonstration videos give fleet wrap scanners an immediate, visual understanding of what a brand offers. A QR code linked to a short video walkthrough lets consumers see a product in action within seconds of scanning. This format works particularly well for brands with complex or visually compelling products that benefit from motion and narration rather than static text. Keeping videos under 60 seconds respects the on-the-go context of someone scanning a moving or parked vehicle. Video content also increases time-on-page metrics, giving marketing teams clearer engagement signals than a simple landing page visit alone.
Event Registration and Lead Capture Forms
Event registration and lead capture forms convert fleet wrap visibility into qualified contacts. A QR code linked to a short mobile form lets consumers register for upcoming events, request quotes, or sign up for newsletters directly from their phone. Minimizing form fields to three or four inputs, such as name, email, zip code, and interest area, reduces friction and increases completion rates. This approach is especially effective for service-based businesses running regional campaigns, where a wrapped vehicle parked near an event venue creates a natural prompt to register. Every completed form becomes a trackable lead tied to a specific vehicle route.
Social Media and Review Platform Links
Social media and review platform links turn a single fleet wrap scan into ongoing brand engagement. A QR code can direct users to an Instagram profile, a Google Business review page, or a curated link-in-bio hub that consolidates multiple social channels. This experience type extends the relationship beyond a one-time interaction. According to the Out of Home Advertising Association of America, 76% of OOH ad engagements occur on a smartphone, meaning scanners are already holding the device they need to follow, like, or leave a review. For brands prioritizing community growth and reputation management, this QR destination delivers compounding value over time.
Real-Time Inventory or Service Locators
Real-time inventory or service locators connect fleet wrap scanners to actionable, location-aware information. A QR code linked to a live inventory feed or service area map helps consumers find the nearest location, check product availability, or book an appointment instantly. This experience type is especially valuable for businesses with multiple service areas or retail locations, because the same wrapped vehicle can serve different audiences depending on where it is parked or routed. Pairing a locator with GPS-tagged dynamic QR codes creates a closed loop between physical vehicle placement and digital conversion data.
With QR code experiences defined, understanding which AR experiences complement these interactions adds another engagement layer to fleet wrap campaigns.
What Types of AR Experiences Work Best on Fleet Wraps?
The types of AR experiences that work best on fleet wraps include 3D product visualizations, animated brand storytelling, virtual try-on features, gamified interactions, and wayfinding content. Each format transforms a wrapped vehicle into an interactive touchpoint.
3D Product Visualizations
3D product visualizations allow consumers to view detailed, three-dimensional renderings of a product by pointing their smartphone at a fleet vehicle’s wrap. A beverage company, for example, can let passersby rotate a virtual bottle, examine its label, and see ingredient details layered over the physical truck. This format works especially well for products that benefit from spatial context, such as furniture, appliances, or industrial equipment, where scale and dimension matter. For fleet campaigns generating tens of thousands of daily impressions, adding a 3D layer converts passive glances into active product exploration. Few advertising formats offer this level of hands-on engagement from a moving asset.
Animated Brand Storytelling
Animated brand storytelling uses AR to overlay motion graphics, character animations, or narrative sequences onto a fleet wrap’s static artwork. A viewer scans the wrap and watches a brand origin story unfold, a mascot come to life, or a supply chain journey animate across the vehicle’s panels. According to Groove Jones, AR campaigns can deliver between 1 and 6 minutes of consumer engagement, far exceeding the 6-to-7-second window typical of traditional billboards. That extended dwell time makes animated storytelling one of the most effective AR formats for building emotional brand connection from a vehicle surface. The key is keeping animations short enough to hold attention at curbside while still conveying a complete narrative arc.
Virtual Try-On and Product Customization
Virtual try-on and product customization experiences let consumers interact with a brand’s offerings directly through their phone’s camera after scanning a fleet wrap. Cosmetics brands can enable users to test lipstick shades on their own face, while eyewear companies let viewers preview frame styles in real time. Product customization takes this further by allowing color, size, or feature selection within the AR interface. These experiences shorten the path from awareness to consideration because consumers evaluate personal fit before visiting a store or website. For fleet wraps covering high-traffic metro routes, virtual try-on turns each vehicle stop into a mobile showroom.
Gamified Interactions and Contests
Gamified interactions and contests use AR to layer playable experiences onto fleet wraps, turning a parked or slow-moving vehicle into an interactive game surface. Scavenger hunts across multiple fleet vehicles, spin-to-win prize wheels, and AR treasure drops tied to specific routes are common formats. Gamification drives repeat engagement because consumers seek out additional vehicles to complete challenges or unlock rewards. Contest mechanics also generate valuable first-party data; participants typically provide an email or phone number to claim prizes. This format is particularly effective for product launches and seasonal campaigns where brands need rapid audience growth and social sharing.
Wayfinding and Location-Based Content
Wayfinding and location-based content uses AR overlays to deliver geographically relevant information when consumers scan a fleet wrap. A delivery vehicle parked near a retail location can display walking directions to the nearest store, highlight current in-store promotions, or surface event schedules specific to that neighborhood. Location-based triggers ensure the AR content updates automatically as the vehicle moves between markets, keeping the experience relevant without reprinting the wrap. This format bridges the gap between mobile advertising and physical retail foot traffic. For brands with distributed locations, wayfinding AR on fleet wraps provides a dynamic store locator that meets consumers exactly where they encounter the vehicle.
How Do You Design Fleet Wraps for QR Code and AR Scanning?
You design fleet wraps for QR code and AR scanning by optimizing placement, sizing, visual contrast, and trigger image quality. The following subsections cover ideal code placement zones, minimum size requirements, design elements that improve scan rates, and AR image optimization for vehicles in motion.
Where Should QR Codes Be Placed on a Fleet Vehicle?
QR codes should be placed on fleet vehicle surfaces where pedestrians and nearby drivers can easily see and scan them while the vehicle is stopped or moving slowly. The most effective zones include:
- Rear panels and tailgates, where vehicles behind can scan at traffic lights and in slow-moving traffic.
- Side panels at pedestrian eye level, roughly 3 to 5 feet from the ground, for scanning at curbside stops and parking areas.
- Rear windows, using perforated window film that maintains interior visibility while displaying the code externally.
- Passenger-side doors, which face sidewalks in curbside-parked positions.
Avoid placing codes near curved body panels, wheel wells, or riveted seams, since surface distortion can break the code’s scannable grid pattern. Every placement should account for typical viewer distance and dwell time at that specific vehicle zone.
How Large Does a QR Code Need to Be for Vehicle Scanning?
A QR code on a vehicle wrap needs to be at least 2 inches by 2 inches for reliable scanning from 6 to 8 feet, according to SignServant. This minimum works for close-range encounters, such as pedestrians walking past a parked vehicle.
For longer scanning distances, the standard rule is a 10:1 ratio: the code width should equal one-tenth of the intended scan distance. A code meant to be scanned from 10 meters away should measure approximately 1 meter across. Fleet designers should calculate the most common viewer distance for each placement zone and size the code accordingly. Oversizing slightly is always safer than undersizing, since environmental factors like motion and angle reduce effective scan range.
What Design Elements Help Riders Notice and Scan a Code?
The design elements that help riders notice and scan a code include high-contrast surroundings, clear calls to action, and glare-resistant finishes.
- Quiet zone: Maintain a white or light-colored border around the code equal to at least four modules wide, keeping it free of overlapping graphics.
- Contrasting background: Place the code against a solid, light-colored panel that visually separates it from the wrap’s busy artwork.
- Matte laminate: Matte finishes improve real-world QR code scan reliability by resisting glare and fingerprints compared to glossy alternatives.
- Clear CTA text: Add a brief, action-oriented prompt such as “Scan for 20% Off” or “Scan to See Our Menu” directly adjacent to the code.
- Directional arrows or icons: A small smartphone icon pointing toward the code draws the eye and communicates the expected interaction.
For most fleet applications, treating the QR code as a distinct design element rather than embedding it within the wrap artwork produces the best scan rates.
How Do You Optimize AR Trigger Images for Moving Vehicles?
You optimize AR trigger images for moving vehicles by maximizing visual contrast, using unique non-repeating patterns, and sizing the trigger area large enough for camera recognition at speed. AR tracking algorithms require high-contrast detail and distinct patterns in the target image to lock focus. Since most platforms process tracker images in grayscale, designs that rely on color differentiation alone will fail.
Key optimization strategies include:
- Asymmetric, detail-rich artwork: Avoid symmetrical logos or repeating patterns, which confuse tracking algorithms.
- Large trigger zones: Size the trackable image area to at least 24 by 24 inches so smartphone cameras can acquire it from a moving car or at a crosswalk.
- High print resolution: Use minimum 300 DPI output to preserve the fine detail that tracking systems depend on.
- Flat panel placement: Position trigger images on flat body surfaces rather than curved panels, preventing geometric distortion that degrades tracking accuracy.
Testing the trigger image under real-world conditions, including varied lighting and vehicle speeds, is the most reliable way to confirm consistent AR activation before a fleet-wide rollout.
With design fundamentals in place, the next consideration is ensuring print materials and platforms meet technical performance standards.
What Technical Requirements Ensure QR and AR Wraps Perform?
QR and AR wraps perform when print specifications, environmental factors, and platform selection align with real-world scanning conditions. The following sections cover material and resolution standards, lighting challenges, and AR platform compatibility.
What Print Resolution and Material Specs Support Scannable Codes?
Print resolution and material specs that support scannable codes include high-DPI output, matte lamination, and substrates optimized for contrast retention. QR codes require sharp module edges, so a minimum print resolution of 300 DPI prevents blurring that disrupts camera recognition.
Material selection matters equally. Matte laminate improves real-world scan reliability by resisting glare and fingerprints compared to glossy finishes. Substrate choice also influences read range; according to Contra Vision, QR codes printed on high-definition perforated window film can be read from approximately 15% further away than the same code on standard perforated film.
For fleet campaigns covering thousands of daily miles, that extended read distance compounds into significantly more successful scans across the life of the wrap.
How Do Lighting and Environmental Conditions Affect Scanning?
Lighting and environmental conditions affect scanning by altering contrast, introducing glare, and reducing camera focus accuracy. Direct sunlight creates specular reflections on glossy surfaces, washing out QR modules and AR trigger images. Overcast conditions and shaded environments, by contrast, tend to produce the most reliable scans.
Other environmental factors that degrade performance include:
- Rain or condensation on the wrap surface, which distorts camera focus.
- Dust and road grime accumulating over modules, reducing contrast between dark and light elements.
- Low-light or nighttime conditions, where insufficient ambient illumination prevents standard phone cameras from resolving code patterns.
Matte laminates and high-contrast color pairings mitigate several of these issues. Routine cleaning schedules for code zones on fleet vehicles are often the simplest, most overlooked way to maintain consistent scan rates across seasons.
Which AR Platforms Are Compatible With Vehicle Wrap Campaigns?
The AR platforms compatible with vehicle wrap campaigns are WebAR solutions that run directly in a mobile browser, eliminating the need for users to download a dedicated app. Platforms such as Blippar’s WebAR SDK and Zappar’s Zapworks support real-time image tracking on standard smartphones, making them practical for fleet activations where passersby interact spontaneously.
Key platform selection criteria include:
- Image tracking accuracy on moving or angled surfaces.
- Browser compatibility across iOS and Android devices.
- Support for 3D model rendering, animation, and video overlay.
- Analytics dashboards for session-level engagement data.
The stakes are high. According to Trick Lidz, vehicle wrap advertising generates between 400 and 600 impressions per mile. Converting even a small fraction of those impressions through AR interaction can produce measurable campaign lift that static wraps simply cannot deliver.
With technical specs, environmental planning, and the right AR platform in place, the next step is measuring whether those interactive elements actually drive results.
How Do You Measure Engagement From Interactive Fleet Wraps?
You measure engagement from interactive fleet wraps by tracking digital KPIs tied to each QR code scan, AR session, and conversion event. The following subsections break down specific metrics for QR code campaigns, AR campaigns, and vehicle-level attribution.
What KPIs Should You Track for QR Code Fleet Campaigns?
The KPIs you should track for QR code fleet campaigns include scan rate, unique versus repeat scans, geographic scan distribution, time-on-page after scan, and conversion rate. Dynamic QR codes make this possible because each code links to a trackable URL with embedded UTM parameters, capturing device type, location, and timestamp per interaction.
Prioritize these core QR code KPIs:
- Total scans measure raw campaign reach across all fleet vehicles.
- Unique scan rate isolates how many individual users engaged versus repeat interactions.
- Scan-to-conversion rate tracks the percentage of scanners who complete the desired action, such as form submission, purchase, or appointment booking.
- Geographic distribution reveals which routes and markets generate the highest engagement.
- Time-on-page indicates content relevance after the scan lands users on the destination page.
According to Blinq, the 10:1 scanning distance ratio directly affects scan reliability, meaning undersized codes produce artificially low scan rates that reflect design failure rather than audience disinterest. Monitoring scan failure rates alongside successful scans helps isolate technical issues from genuine engagement gaps.
What KPIs Should You Track for AR Fleet Campaigns?
The KPIs you should track for AR fleet campaigns are session initiation rate, average dwell time, interaction depth, and social share rate. AR experiences generate richer behavioral data than QR codes because users actively engage with 3D content rather than passively viewing a landing page.
Key AR-specific metrics include:
- Session initiation rate measures how many viewers launch the AR experience after noticing the vehicle.
- Average dwell time captures how long users remain in the AR session, with longer sessions indicating stronger content engagement.
- Interaction depth tracks specific actions within the experience, such as rotating a 3D product, completing a game, or tapping through content layers.
- Social share rate records how often users screenshot or share the AR experience organically.
- Drop-off points identify where users abandon the session, revealing friction in the experience flow.
For most fleet campaigns, dwell time is the single most telling AR metric. A user who spends 90 seconds inside a branded 3D experience absorbs far more messaging than one who glances at a static wrap for two seconds.
How Do You Attribute Conversions to a Specific Wrapped Vehicle?
You attribute conversions to a specific wrapped vehicle by assigning unique tracking identifiers to each vehicle in the fleet. This means every vehicle carries its own dynamic QR code or AR trigger linked to a distinct UTM string, landing page variant, or promo code.
Effective vehicle-level attribution methods include:
- Vehicle-specific UTM parameters embedded in each QR code, tagging the source vehicle by ID, route, or region.
- Unique promo codes printed on individual vehicles, tying redemptions directly to the originating wrap.
- Dedicated landing page variants per vehicle or route cluster, isolating traffic and conversion data in analytics platforms.
- Geofenced scan correlation matching scan timestamps and GPS coordinates against known vehicle routes.
This granular approach transforms a fleet from an unmeasurable branding tool into a performance channel. When one vehicle consistently outperforms others, route optimization and wrap design iteration become data-driven decisions rather than guesswork.
With clear measurement frameworks established, avoiding common implementation mistakes protects these performance gains.
What Are Common Mistakes to Avoid With Interactive Fleet Wraps?
Common mistakes to avoid with interactive fleet wraps include linking QR codes to non-mobile-optimized pages, using codes that are too small or poorly positioned, and overloading the wrap design with too many technology layers.
What Happens When QR Codes Link to Non-Mobile-Optimized Pages?
When QR codes link to non-mobile-optimized pages, the majority of scans result in immediate bounce-backs and lost conversions. Nearly all QR code interactions on fleet vehicles happen via smartphone, so a landing page that loads slowly, displays improperly, or requires pinch-zooming creates friction at the most critical moment of engagement.
Common issues with non-mobile-optimized destinations include:
- Slow load times that exceed three seconds on cellular connections.
- Text and buttons too small to tap accurately on a phone screen.
- Forms requiring excessive typing instead of autofill-friendly fields.
- Pop-ups or interstitials that block content on mobile browsers.
Every QR code destination should be tested on multiple devices before a fleet wrap goes into circulation. A broken mobile experience does not just waste one scan; it discourages repeat engagement across an entire campaign.
Why Do Small or Poorly Placed QR Codes Fail on Fleet Vehicles?
Small or poorly placed QR codes fail on fleet vehicles because smartphone cameras cannot resolve the code’s data modules at typical viewing distances. Fleet wraps operate in dynamic environments where passersby, pedestrians, and drivers encounter the vehicle from varying angles and ranges.
Key sizing and placement failures include:
- Codes smaller than two inches that become unscannable beyond arm’s length.
- Placement on curved panels, wheel wells, or bumpers where distortion breaks the code matrix.
- Positioning below the vehicle’s sight line where parked cars or curbs obstruct the view.
- Lack of quiet zone (clear border) around the code, causing scanners to misread adjacent graphics.
For most fleet applications, placing the QR code at eye level on flat body panels with generous surrounding contrast produces the most reliable scan rates.
How Does Overloading a Wrap With Technology Hurt Engagement?
Overloading a wrap with technology hurts engagement by splitting viewer attention across too many competing calls to action. When a single vehicle surface presents a QR code, an AR trigger, an NFC tag, and multiple URLs simultaneously, the viewer faces decision paralysis during a brief exposure window.
According to a 2023 OAAA study, 78% of adults recently engaged with an out-of-home advertisement, with 76% of those engagements occurring on a smartphone. That data confirms the audience is willing to interact, but only when the path is clear and singular.
Additional risks of technology overload include:
- Platform dependency on tools that may lose support, as demonstrated when the 8th Wall hosted platform was retired on February 28, 2026.
- Increased production costs without proportional engagement gains.
- Cluttered visual hierarchy that undermines core brand messaging.
The most effective interactive fleet wraps prioritize one primary technology per vehicle face and reserve secondary interactions for dedicated campaign microsites. Simplicity, not complexity, drives the highest conversion rates in mobile out-of-home environments.
With common pitfalls identified, comparing interactive wraps to static alternatives clarifies the performance gap.
How Do Interactive Fleet Wraps Compare to Static Fleet Wraps?
Interactive fleet wraps compare to static fleet wraps by adding scannable technology layers, such as QR codes and augmented reality, that transform passive vehicle graphics into measurable, two-way engagement tools. Static wraps build brand visibility through high-impression exposure alone. Interactive wraps retain that visibility while also capturing consumer data, directing traffic to digital destinations, and enabling real-time campaign adjustments. Fleet branding, whether through mobile billboards or commercial vehicle wrapping, generates consistent impressions across metropolitan routes. However, the distinction lies in what happens after a viewer notices the vehicle. Static designs rely entirely on visual recall; interactive designs convert that attention into trackable actions. For brands investing in transit advertising, the choice depends on whether the campaign goal is pure awareness or measurable consumer response. Interactive wraps cost more upfront but provide attribution data that static wraps simply cannot deliver, making ROI calculations far more precise.
How Can Experiential Marketing Vehicles Maximize QR and AR Impact?
Experiential marketing vehicles maximize QR and AR impact by combining custom-fabricated physical environments with interactive digital technology. The following sections cover how purpose-built vehicles enhance campaigns and the key takeaways from this article.
Can Custom-Fabricated Experiential Vehicles Enhance Interactive Wrap Campaigns?
Yes, custom-fabricated experiential vehicles can enhance interactive wrap campaigns by transforming a standard fleet asset into a fully immersive brand environment. Craftsmen Industries designs and engineers experiential marketing vehicles from the ground up, integrating structural elements that support QR code placement, AR trigger surfaces, and interactive digital displays within a single build.
Purpose-built vehicles offer advantages that standard wraps on stock vehicles cannot match:
- Dedicated scanning zones with controlled lighting eliminate glare and environmental interference.
- Engineered flat panel surfaces provide ideal high-contrast areas for AR image tracking.
- Built-in digital screens and audio systems extend the interactive experience beyond the phone.
- Custom interior buildouts allow consumers to step inside the brand story after scanning.
Because Craftsmen Industries controls every phase from ideation to fabrication and large format graphics printing in-house, QR and AR elements are designed into the vehicle architecture rather than applied as an afterthought. This integrated approach produces more reliable scan performance and longer consumer engagement. For brands planning mobile tours or event activations, a purpose-built experiential vehicle is the most effective platform for interactive wrap technology.
What Are the Key Takeaways About How QR Codes and Augmented Reality on Fleet Wraps Boost Engagement We Covered?
The key takeaways about how QR codes and augmented reality on fleet wraps boost engagement are rooted in measurable interaction, smart design, and the right technology choices.
According to a comparative analysis by Groove Jones, AR campaigns can deliver between 1 and 6 minutes of consumer engagement, far exceeding the 6-to-7-second optimal message window of traditional billboards. That extended dwell time represents the core value proposition of interactive fleet wraps.
The most important lessons from this article include:
- Dynamic QR codes let brands update campaign destinations without reprinting vinyl, keeping content fresh across routes and markets.
- Proper sizing, placement, and matte lamination directly determine whether a QR code scans reliably in real-world conditions.
- AR trigger images need high-contrast, unique patterns to activate tracking algorithms on moving surfaces.
- Measurable KPIs such as scan rates, dwell time, and geographic attribution turn fleet wraps into accountable performance media.
- Purpose-built experiential vehicles from Craftsmen Industries integrate interactive technology at the fabrication stage for superior scan reliability and deeper consumer engagement.
Every element covered in this article points to one conclusion: when QR codes and AR are designed into fleet wraps with the right specifications and strategic intent, they convert passive impressions into active, trackable consumer interactions.
Filter Posts by Tag
related posts
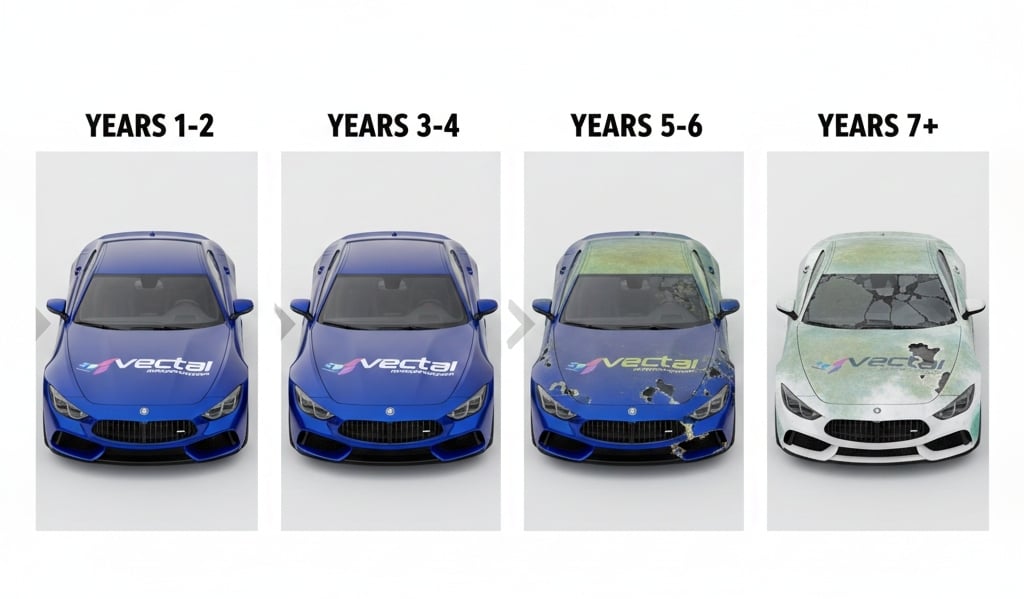
Discover how long vinyl car wraps last—typically 5–7 years. Learn factors affecting lifespan, maintenance tips, and when replacement is needed.
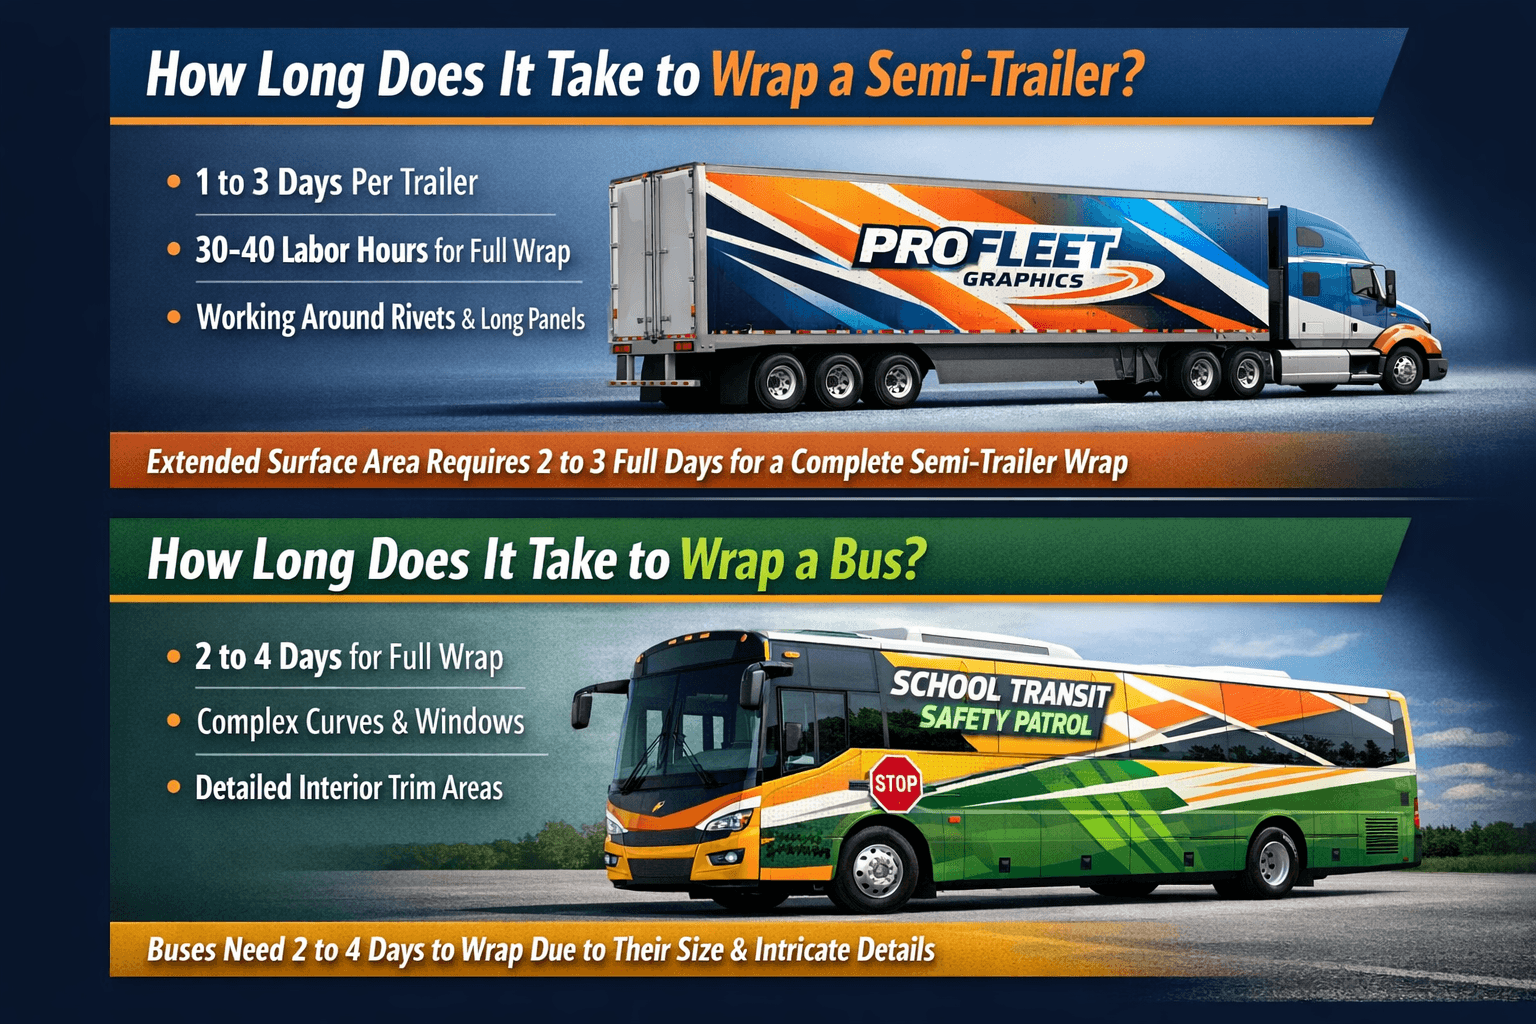
Fleet wrap turnaround time is the total duration from initial [...]
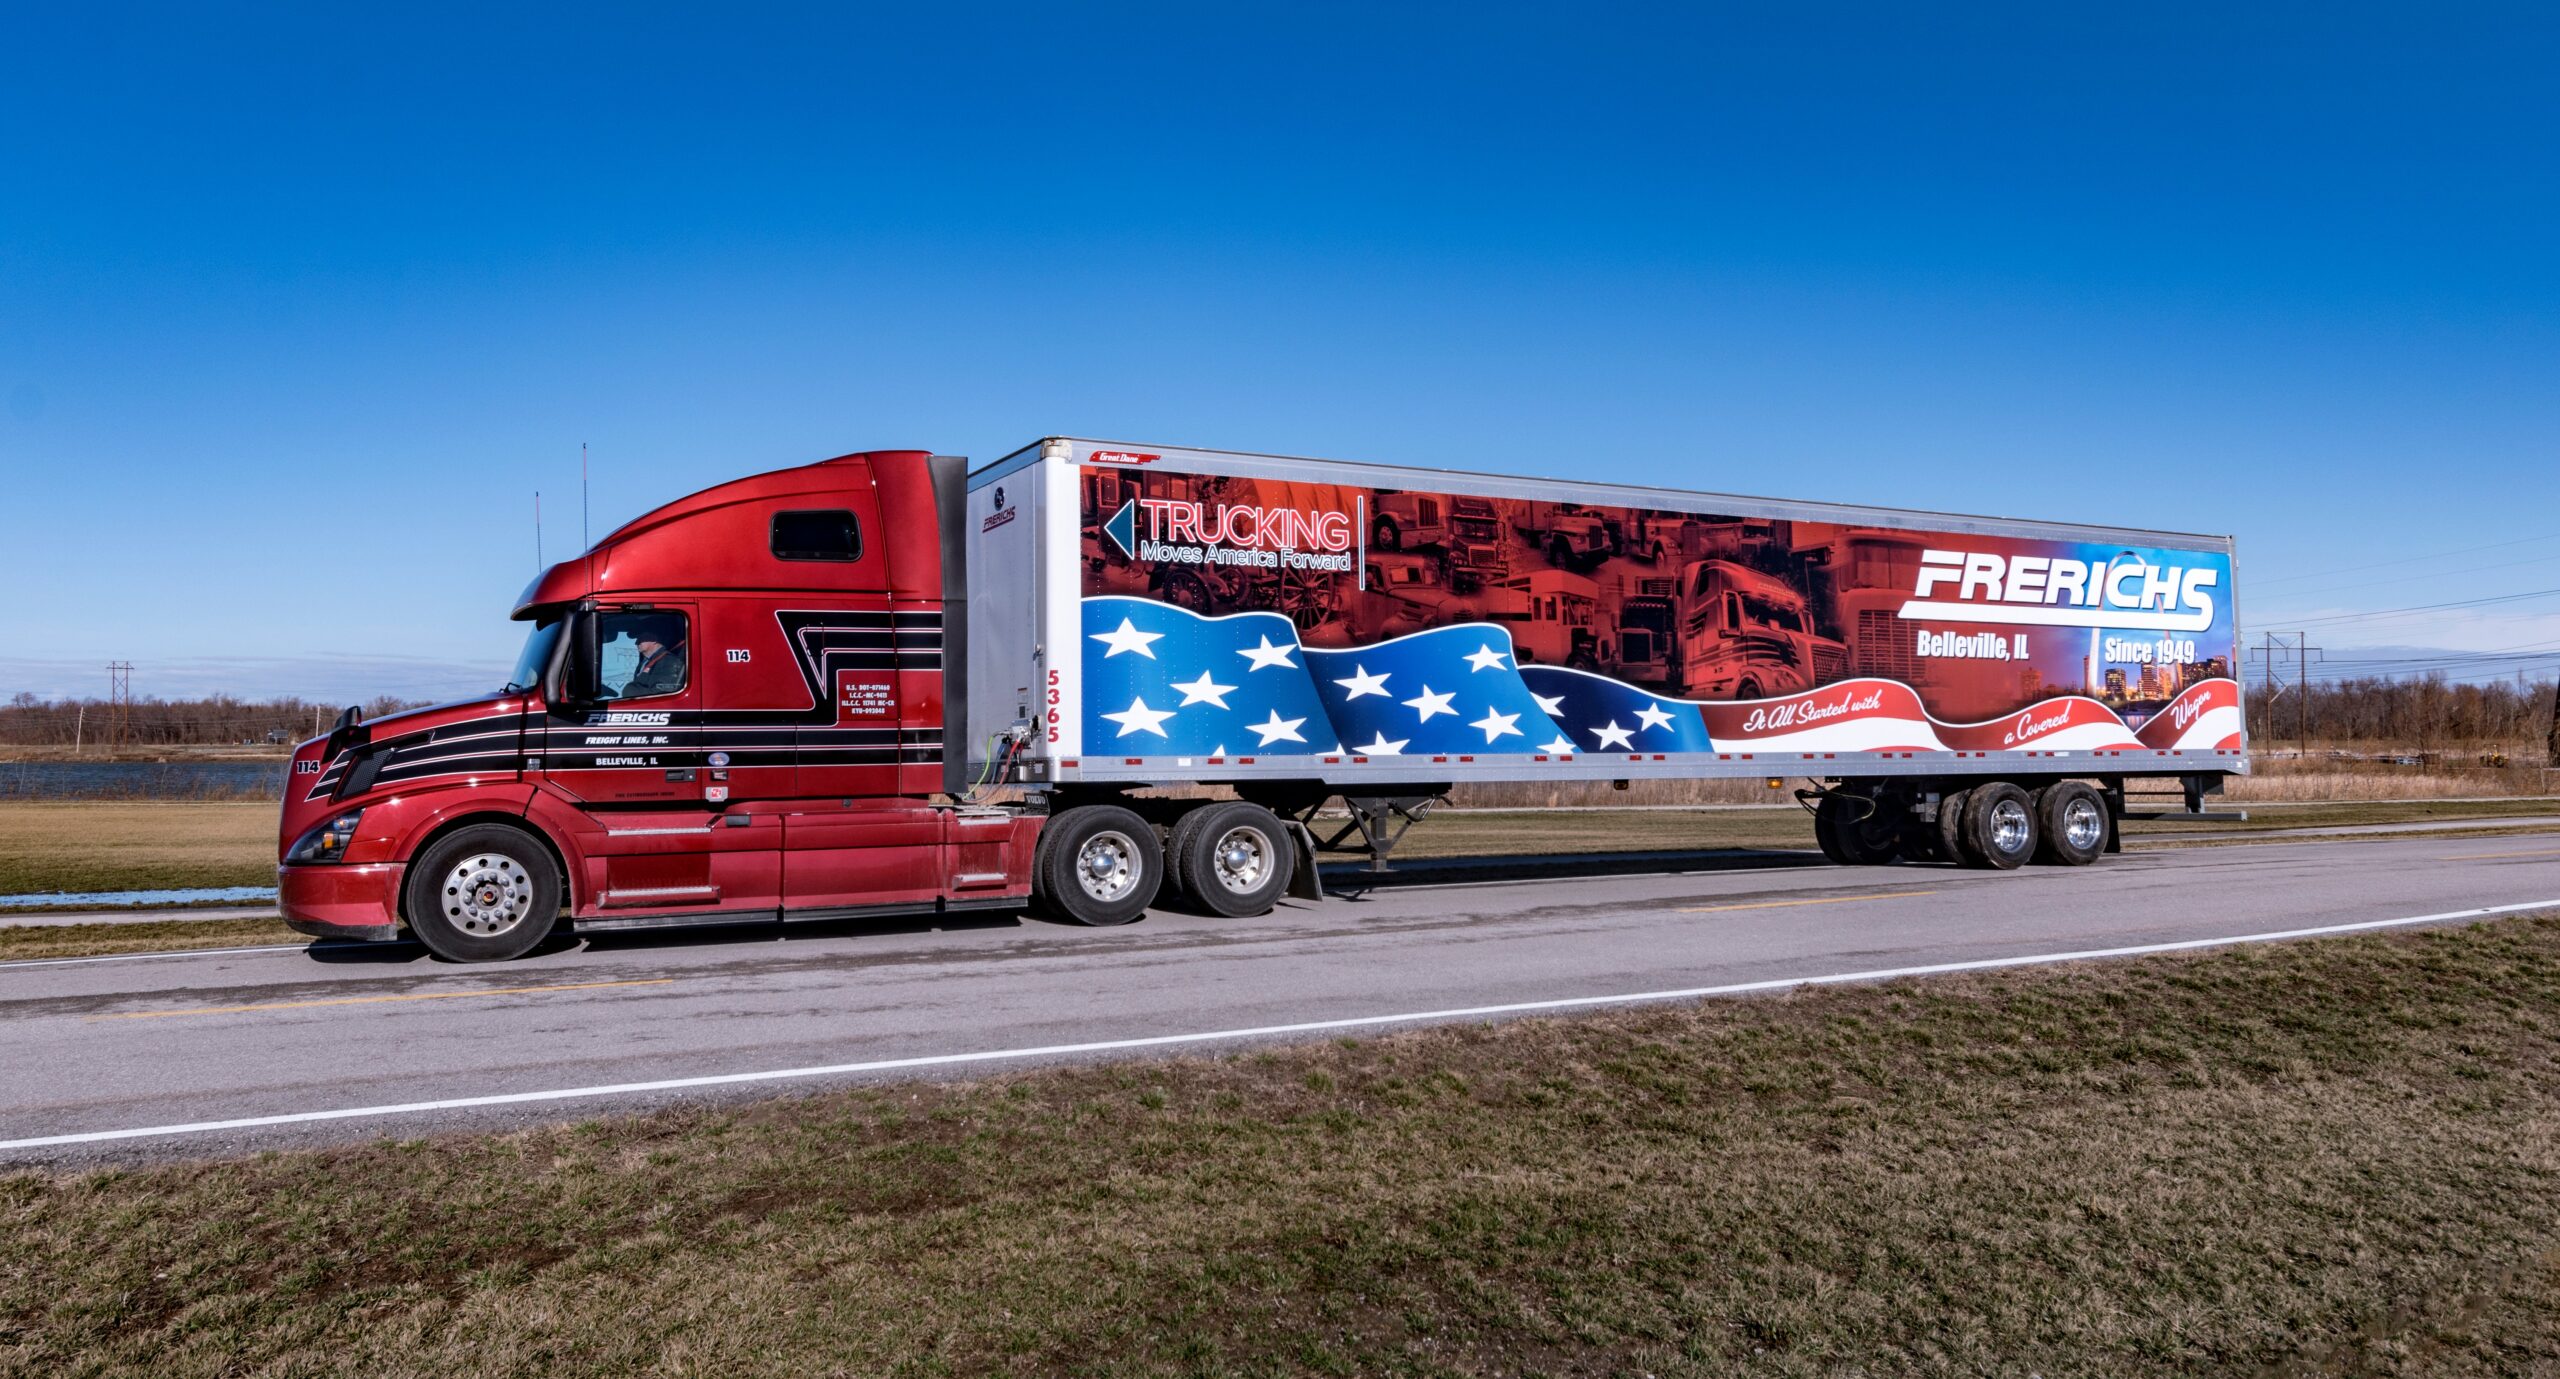
Turning a vehicle into a mobile billboard is an excellent advertising strategy. But are fleet wraps durable? Learn from experts and find out where to get them.
